Quicklinks
Top Results
2024 Annual Report
In 2024, we took a historic step forward, merging our two credit unions into one so that we can continue to serve members across the state in a new way. This transition means we’ll control our own destiny and be better prepared for the future. Committing to the financial well-being of our members starts with the assurance that we’re ready to serve them into tomorrow.


We’re stunned at all we
accomplished in 2024
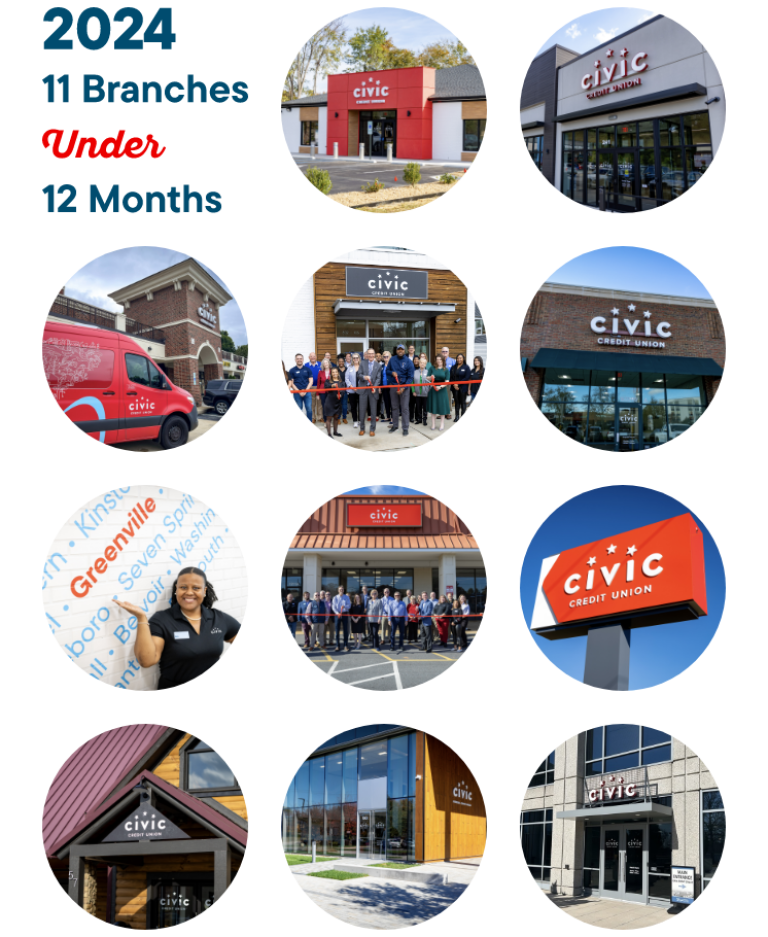
We opened 11 branches in under a year, introduced a full line of traditional and new financial products, and doubled down on our commitment to partnerships for a stronger North Carolina. In between, we hit the road, visiting thousands of members, sharing our story.
We’ve come so far, but 2025 is no finish line. We’re just getting started.
Letter from our Board Chair
Ken Noland
Dear members,
Thank you for sharing in this historic time in the life of your credit union, as we approach Civic Day this June when we become an independent credit union! Your Board and management team have planned well and are completely prepared for this historic day, a day to honor our history and to celebrate our future.

Dwayne Naylor
CEO Report
To all members,
It is my privilege to share this 2024 CEO Report. The work of the past year, as the years before it, moved us closer to an exciting milestone in our 42-year credit union history: Civic Day is coming this June. It’s the day we become a completely independent credit union, ushering us into the future!

Impact Report
2024 was an amazing year for our credit unions. Never in our history have we done so much in such a short time.
Here are a few of the highlights:
- Developed or identified dozens of financial products and services for Civic members
- Created 11 Civic branches in under 12 months
- Combined two credit unions into one when Civic members voted to merge into LGFCU
- Worked in partnership with SECU as we readied our members for independence
- Supported and donated to hundreds of local government employees as they struggled to recover from Hurricane Helene

Board of Directors
Each Board Director is elected by and from among the credit union's membership. These men and women perform key audit and decision-making functions, set policies for the credit union, and appoint its CEO and members of the Supervisory and Loan Committees.
To read about the professional backgrounds of each Board Director, visit the Board of Directors page.

Ken Noland, Chair
Wilkesboro

David Dear, Vice Chair
Shelby

Jeanne Erwin, Treasurer
Cary

Ruth Barnes, Secretary
Atlantic Beach

Dr. Aaron Noble
Burlington

Lin Jones
Durham

Kellie Blue
Robeson County

Paul Miller
Snow Hill

Tony Brown
Halifax County
Supervisory Committee
The duty of this committee is to inspect the credit union's records for accuracy, its assets for security, and its procedures for the proper handling and use of funds.
Amy Bason
Raleigh
Ryan Draughn
Sanford
Emily Lucas
Wake Forest
Justin Merritt
Shelby
Shawn Purvis
Apex
Loan Review Committee
When members exercise their right to appeal a loan decision, this committee has the authority to review that decision and choose to uphold it or approve the loan.
Wilbert McAdoo
Efland
Jim Baker
Chapel Hill
Mike Eubank
Kill Devil Hills
Diana Harris
Cary
Nancy Held
Raleigh
Pam Hurdle
Hertford
Dale Johnson
Raleigh
Nancy Medlin
Garner
Charles Murray
Louisburg
Jean Stowers
Surf City
Sam Tingler
Holly Springs
Charles Weber
Washington State
Mark Williams
Wake Forest
Advisory Council
Our Advisory Council members are the volunteers who help shape our credit union. We would not be where we are today without their advocacy and assistance. We salute them and thank them for their many contributions.
Financial Report
By the numbers
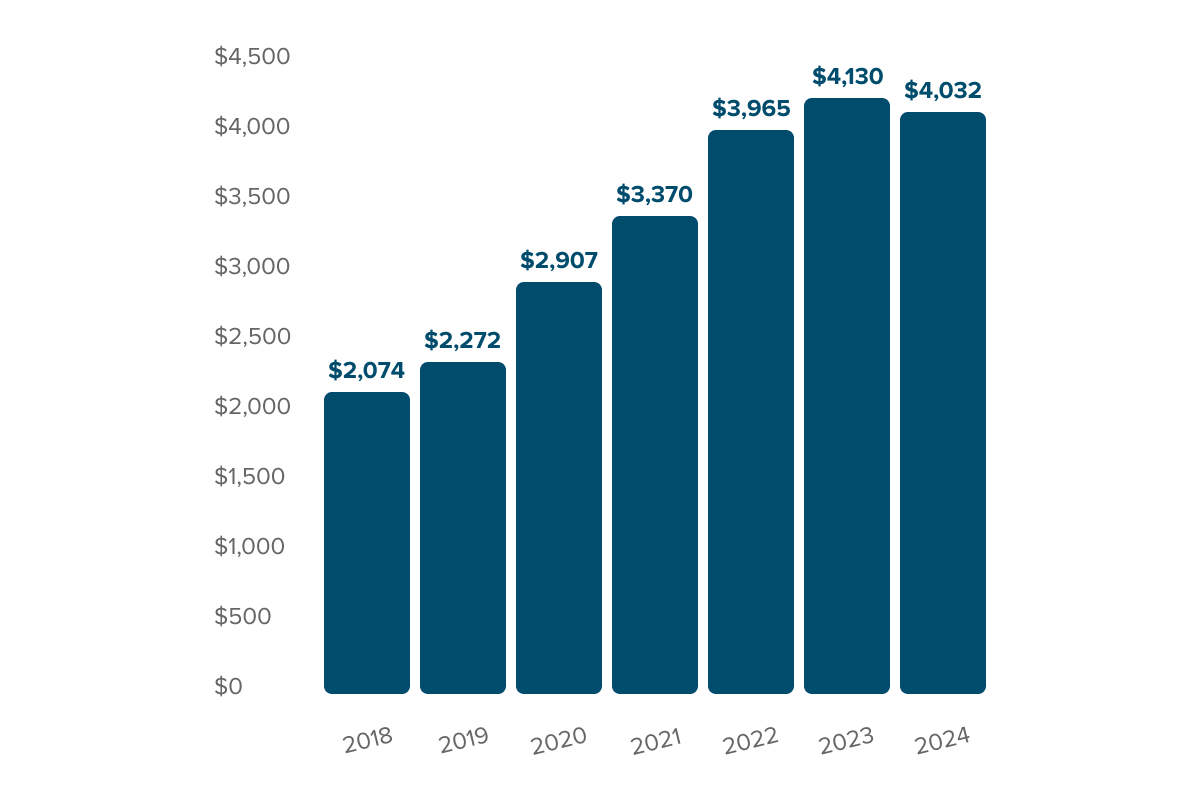
Asset growth
(in millions)

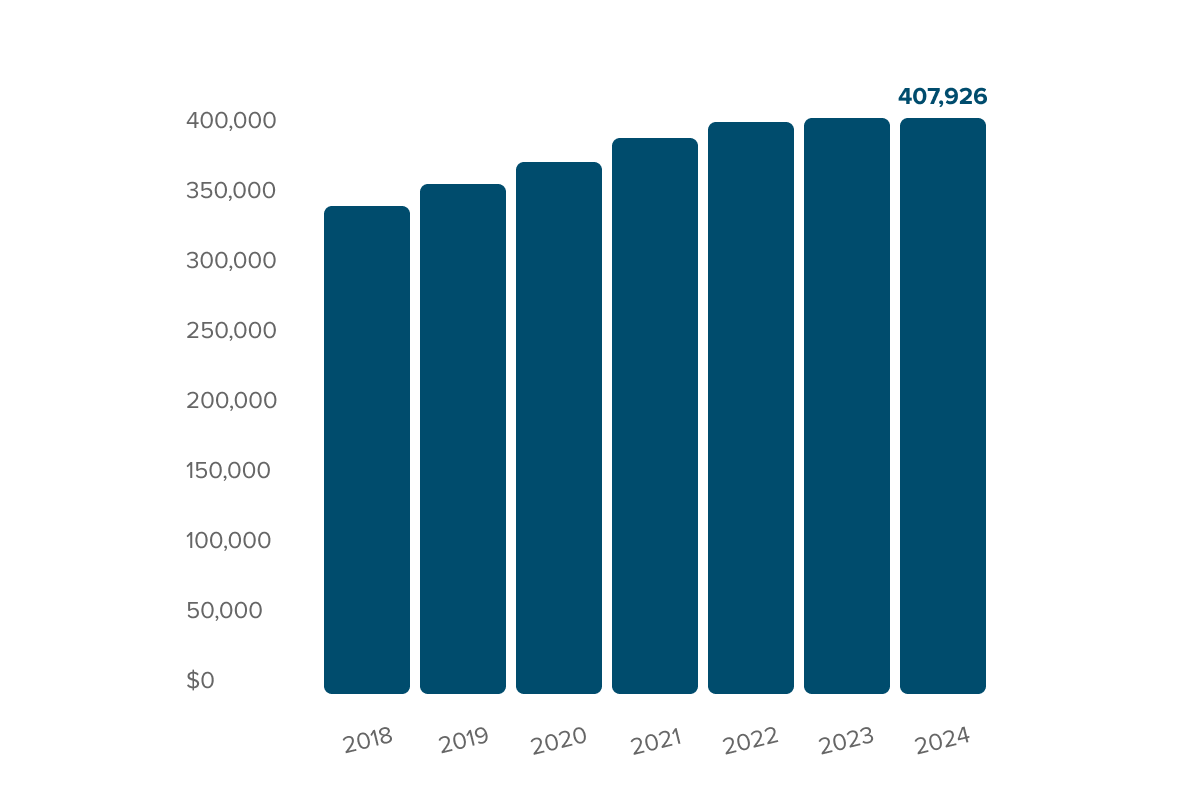
Membership growth
1% increase in membership 2023-2024

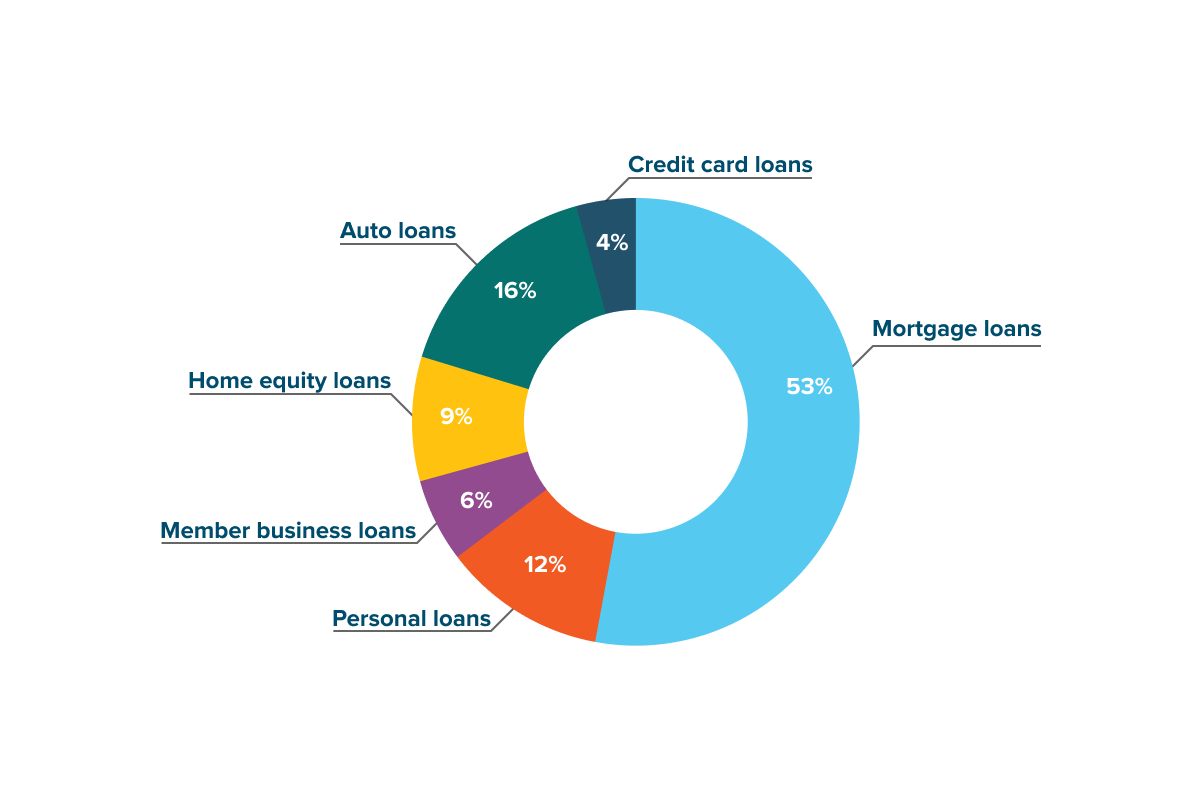
Loan portfolio mix

Investment portfolio mix

Statements of Financial Condition
| 0 | Assets | 2024 | 2023 |
|---|---|---|---|
| 1 | Cash and Investments | $320,270,799 | $361,798,350 |
| 2 | Mortgage Loans | $1,877,088,030 | $1,992,887,643 |
| 3 | Personal Loans | $417,665,826 | $400,607,703 |
| 4 | Member Business Loans | $214,055,251 | $200,058,966 |
| 5 | Home Equity Loans | $318,873,374 | $272,256,524 |
| 6 | Auto Loans | $567,277,678 | $653,361,493 |
| 7 | Credit Card Loans | $152,619,062 | $153,418,540 |
| 8 | Allowance for Loan Losses | ($51,044,257) | ($65,233,528) |
| 9 | Net Loans | $3,496,534,965 | $3,607,357,341 |
| 10 | National Share Insurance | $33,747,490 | $31,178,532 |
| 11 | Other Assets | $181,644,692 | $129,642,925 |
| 12 | Total Assets | $4,032,197,946 | $4,129,977,148 |
| 0 | Liabilities & Equity | 2024 | 2023 |
|---|---|---|---|
| 1 | Payables | $126,784,823 | $416,917,165 |
| 2 | Share Accounts | $773,301,753 | $825,177,724 |
| 3 | Share Draft Accounts | $561,066,529 | $590,174,774 |
| 4 | Money Market Accounts | $841,952,629 | $851,525,499 |
| 5 | Individual Retirement Accounts | $184,355,242 | $213,051,779 |
| 6 | Share Certificates | $1,261,559,604 | $947,774,550 |
| 7 | Total Deposits | $3,622,235,756 | $3,427,704,325 |
| 8 | Total Reserves & Undivided Earnings | $283,177,367 | $285,355,658 |
| 9 | Total Liabilities & Equity | $4,032,197,946 | $4,129,977,148 |
Year to date as of 12/31/2024 and 12/31/2023.
Statements of Income
| 0 | Operating Income | 2024 | 2023 |
|---|---|---|---|
| 1 | Investment Income | $14,756,003 | $14,105,844 |
| 2 | Mortgage Loans | $76,294,345 | $79,630,936 |
| 3 | Personal Loans | $44,456,137 | $39,977,592 |
| 4 | Home Equity Loans | $21,687,988 | $12,385,448 |
| 5 | Auto Loans | $39,496,588 | $34,928,283 |
| 6 | Credit Card Loans | $21,041,946 | $20,279,360 |
| 7 | Member Business Loans | $7,241,599 | $6,378,697 |
| 8 | Total Loan Income | $210,218,603 | $193,580,316 |
| 9 | Other Operating Income | $62,596,757 | $57,697,241 |
| 10 | Total Income | $287,571,362 | $265,383,401 |
| 0 | Operating Expenses | 2024 | 2023 |
|---|---|---|---|
| 1 | Operating Expenses | $196,056,228 | $202,829,961 |
| 2 | Interest on Borrowed Funds | $9,984,211 | $24,591,247 |
| 3 | Share Accounts | $3,269,403 | $3,269,403 |
| 4 | Share Draft Accounts | $645,165 | $833,828 |
| 5 | Money Market Accounts | $16,157,933 | $18,513,137 |
| 6 | Individual Retirement Accounts | $4,399,025 | $4,828,519 |
| 7 | Share Certificates | $58,625,220 | $22,456,597 |
| 8 | Total Deposit Expense | $83,096,745 | $53,292,064 |
| 9 | Total Expenses | $289,137,185 | $280,713,273 |
| 10 | Net Operating Income | ($1,565,822) | ($15,329,872) |
Year to date as of 12/31/2024 and 12/31/2023.
Nature of operations
Local Government Federal Credit Union (the “Credit Union”) is a not-for-profit cooperative that serves employees of local government units. The Credit Union is organized under the laws of the Federal Credit Union Act and is exempt, by statute, from federal and state income and sales taxes. The Credit Union serves its members through the State Employees' Credit Union (SECU) network. This network includes more than 250 branches and more than 1,000 ATMs in all of North Carolina's 100 counties. Its subsidiary, Civic Federal Credit Union, serves members through Civic branches statewide and the nationwide CO-OP Shared Branch Network. The Credit Union's primary source of revenue is its loan portfolio.
Audited financial statements
The financial reports provided here have not been audited. You can review audited financial statements for the annual period ending June 30, 2023, from the Credit Union's accounting firm, CliftonLarsonAllen LLP, posted in the Audit Report section. These financial statements include a more in-depth financial analysis and extensive footnote disclosures that provide additional information on the results of the Credit Union for the respective period ends as noted above. Open and view this current Audit Report in a separate tab outside of this document.


